Okay, you’ve got TensorFlow or PyTorch installed on your Windows machine with GPU support enabled (like we discussed in the previous guide for TensorFlow). That’s a huge step towards faster Machine Learning (ML) training. But sometimes, even with a powerful GPU, training can feel slower than expected.
Simply having the GPU doesn’t automatically mean your training is fully optimized. Bottlenecks can occur in other parts of your system or workflow. By applying specific techniques, you can ensure your GPU is working at its full potential and significantly speed up your ML training. I was amazed by the difference some of these optimizations made when I first implemented them.
Why Optimization Matters for GPU Training
When you move ML training from a CPU to a GPU, the pure mathematical computations (like matrix multiplications) become much faster. However, other parts of the process, like getting the data ready for the GPU or how efficiently the model uses the GPU’s resources, can become the new slowdowns. Optimization helps address these issues.
How to Speed Up Machine Learning Training on Windows with GPU
Here are several steps and techniques you can use to make your ML training faster on Windows when using a GPU:
Step 1: Verify Your GPU is Actually Being Used
This might sound obvious, but it’s the first thing to check. Ensure your code is running on the GPU and that the GPU is active during training.
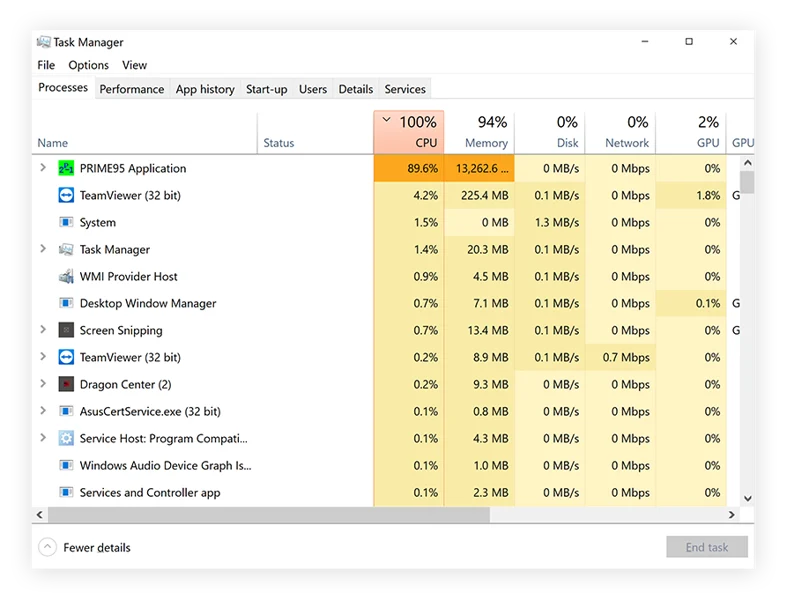
- Check GPU Activity:
- Open Task Manager (Ctrl + Shift + Esc). Go to the ‘Performance’ tab. Click on your GPU. Look at the usage graphs (like “Compute 0” or “3D”). During training, you should see significant activity here, often close to 100%.
- If you have an NVIDIA GPU, open Command Prompt and run
nvidia-smi. This tool shows GPU utilization, memory usage, and running processes. Look for your Python process using GPU memory and showing high utilization during training.
- Verify in Code: Use the framework’s API to confirm GPU availability and usage.
- TensorFlow: Add code like
tf.config.list_physical_devices('GPU')to see detected GPUs. Usetf.debugging.set_log_device_placement(True)temporarily in your code to see messages indicating which device (CPU or GPU) operations are being placed on during execution. - PyTorch: Use
torch.cuda.is_available()andtorch.cuda.current_device()to check availability and the active GPU. Ensure your model and data tensors are moved to the GPU (e.g.,model.to('cuda'),data.to('cuda')).
- TensorFlow: Add code like
If your GPU isn’t showing activity, revisit your TensorFlow/PyTorch installation and configuration steps.
Step 2: Optimize Data Loading and Preprocessing
A common bottleneck is feeding data to the GPU fast enough. The GPU can process batches of data very quickly, but if it has to wait for the CPU to load and preprocess the next batch, the GPU sits idle.
- Use Built-in Data Pipelines: Machine learning frameworks provide optimized tools for this.
- TensorFlow: Use the
tf.dataAPI to build efficient data pipelines. This allows for parallel loading, buffering, and prefetching data while the GPU is busy with the current batch. - PyTorch: Use the
torch.utils.data.DataLoaderclass. Configure it withnum_workers > 0to load data in parallel processes on the CPU. Usepin_memory=Trueandnon_blocking=Truewhen moving data to the GPU (data.to('cuda', non_blocking=True)) for faster transfer.
- TensorFlow: Use the
- Store Data on Fast Storage: Loading data from a slow HDD will be slower than loading from a fast SSD or NVMe drive.
- Perform Preprocessing Strategically: Do as much computationally expensive preprocessing as possible before training and save the processed data. For transformations needed during training (like data augmentation), leverage GPU-accelerated libraries if available, or ensure your data loading pipeline handles it efficiently in parallel on the CPU.
Step 3: Choose an Appropriate Batch Size
The batch size (the number of samples processed in one forward/backward pass) significantly impacts GPU utilization.
- Larger Batch Size: Generally leads to better GPU utilization because the GPU can perform calculations on more data in parallel. This often speeds up training per epoch.
- GPU Memory Limit: The main constraint is your GPU’s memory (VRAM). You must choose a batch size that fits within your GPU’s memory along with the model parameters and intermediate calculations.
- Finding the Right Size: Experiment with the largest batch size that fits comfortably in your GPU memory without causing “out of memory” errors. While larger batches speed up computation, very large batches might require more epochs to converge, and very small batches might train slower per epoch but can sometimes lead to faster convergence or better generalization. It’s a trade-off you might need to tune.
Step 4: Use Mixed Precision Training
Modern NVIDIA GPUs (those with Tensor Cores, generally RTX series and later) are highly optimized for lower-precision floating-point numbers, specifically FP16 (16-bit) compared to the standard FP32 (32-bit).
- How it Works: Mixed precision training uses a combination of FP16 and FP32. Model parameters are typically stored in FP32 for accuracy, but computations are performed in FP16 where possible. Gradient values are often kept in FP16 but converted back to FP32 for updating the master copy of weights.
- Benefits: Can significantly speed up training (sometimes 2x or more) and reduce GPU memory usage, allowing for larger batch sizes.
- How to Enable:
- TensorFlow (Keras): Add
tf.keras.mixed_precision.set_global_policy('mixed_float16')at the beginning of your script. - PyTorch: Use
torch.cuda.amp.autocast()within your training loop for forward passes andtorch.cuda.amp.GradScaler()to handle gradient scaling during the backward pass and optimization steps.
- TensorFlow (Keras): Add
- Requirement: Your GPU must support FP16 computations efficiently (Tensor Cores). Check your GPU specifications.
Step 5: Choose Efficient Model Architectures
Some model architectures are inherently more computationally expensive or less efficient on GPUs than others. While likely beyond a simple “how-to” step-by-step code change, understanding this can inform your model choices if speed is critical. Architectures designed with GPU parallelism in mind tend to perform better.
Step 6: Profile Your Training Code
If you’ve tried basic optimizations and still have speed issues, profiling can help pinpoint the exact bottlenecks – is it the GPU waiting, data loading, or something else?
- Framework Tools: TensorFlow and PyTorch have profiling tools that can show how much time is spent on the CPU, GPU, and moving data between them.
- TensorFlow: Use the TensorFlow Profiler.
- PyTorch: Use the PyTorch Profiler.
- Interpretation: Analyzing the profiling output helps identify where the slowdowns are occurring so you can focus your optimization efforts.
Step 7: Keep Software Updated
Regularly updating your NVIDIA drivers, CUDA Toolkit, cuDNN, and the TensorFlow/PyTorch libraries themselves can often provide performance improvements and bug fixes from the developers.
Other Potential Bottlenecks
Even with GPU optimization, your training speed can be limited by:
- CPU Speed: If your CPU is too slow, it can bottleneck data loading and preprocessing, even with parallel workers.
- System RAM: Not having enough RAM can lead to slow data loading or swapping.
- Storage Speed: As mentioned, a slow hard drive will limit how quickly data can be fed to the CPU/GPU.
Speeding up Machine Learning training on Windows with a GPU involves more than just installing the right software. It requires verifying GPU usage, optimizing how data gets to the GPU, tuning parameters like batch size, potentially using mixed precision, and understanding where bottlenecks lie. By applying these techniques, you can significantly reduce training times and iterate on your models much faster.